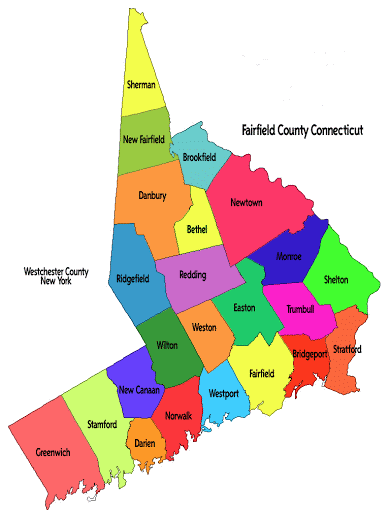
The following chart highlights the number of housing units and number and percentage of affordable (subsidized units) by town in Fairfield County.
Norwalk’s affordable housing percentage is higher than the state and Fairfield County and is third behind Bridgeport and Stamford.
| City Town | Total Housing Units (2013-17) | Affordable Housing Units (2018) | % of Housing |
| State | 1,507,711 | 167,879 | 11.1% |
| Fairfield County | 369,044 | 34,037 | 9.2% |
| Bethel | 7554 | 428 | 5.6% |
| Bridgeport | 58,124 | 11,593 | 19.9% |
| Brookfield | 6573 | 352 | 5.3% |
| Danbury | 32,658 | 3373 | 10.3% |
| Darien | 7045 | 252 | 3.5% |
| Easton | 2837 | 16 | .05% |
| Fairfield | 21,615 | 527 | 2.4% |
| Greenwich | 24,617 | 1,297 | 5.2% |
| Monroe | 7312 | 93 | .01% |
| New Canaan | 1676 | 152 | .9% |
| New Fairfield | 5898 | 80 | 1.3% |
| Newtown | 10,282 | 248 | 2.4% |
| NORWALK | 35,458 | 4516 | 12.7% |
| Redding | 3893 | 14 | .03% |
| Ridgefield | 9,645 | 279 | 2.8% |
| Shelton | 17,130 | 503 | 2.9% |
| Sherman | 1764 | 7 | .03% |
| Stamford | 53,257 | 7648 | 14.3% |
| Stratford | 21,745 | 1343 | 6.1% |
| Trumbull | 12,898 | 592 | 4.5% |
| Weston | 3912 | 7 | .01% |
| Westport | 10,870 | 350 | 3.2% |
| Wilton | 6466 | 259 | 4% |